
Partnering with CEOs, boards, and growth-stage teams to align strategy, systems, and leadership for scalable, sustainable growth. I bridge the gap between high-level executive advisory and hands-on operational execution.
Key Highlights & Capabilities
Built, optimized, and managed custom HubSpot and Salesforce environments for over 10 tech and SaaS clients. Transformed pipeline chaos into clean data by defining lifecycle stages, required fields, and hygiene expectations.
Implemented practical AI workflows for account intelligence, "stage-zero" research, content iteration, and pitch development. Increased seller speed and throughput without sacrificing quality controls.
Stood up lightweight, rigorous forecasting rhythms and pipeline reporting to improve CEO visibility and rep accountability without adding unnecessary bureaucracy. Designed KPI dashboards tracking CAC, LTV, conversion velocity, and stage-aging.
Led client-facing QBRs and coached sales leaders through complex deal reviews, discovery strategies, and close plans. Acted as the executive sponsor and closer on high-stakes, multi-stakeholder enterprise pursuits.
Deployed signature Uplida models—including the RevOps Accelerator™, ScaleOps Blueprint™, and Leadership Alignment Lab™—to integrate culture with performance and translate market insights into actionable 90-day execution backlogs.

My Work
How I leverage data and process to drive predictable revenue. From high-level executive dashboards to granular deal-level scorecards.
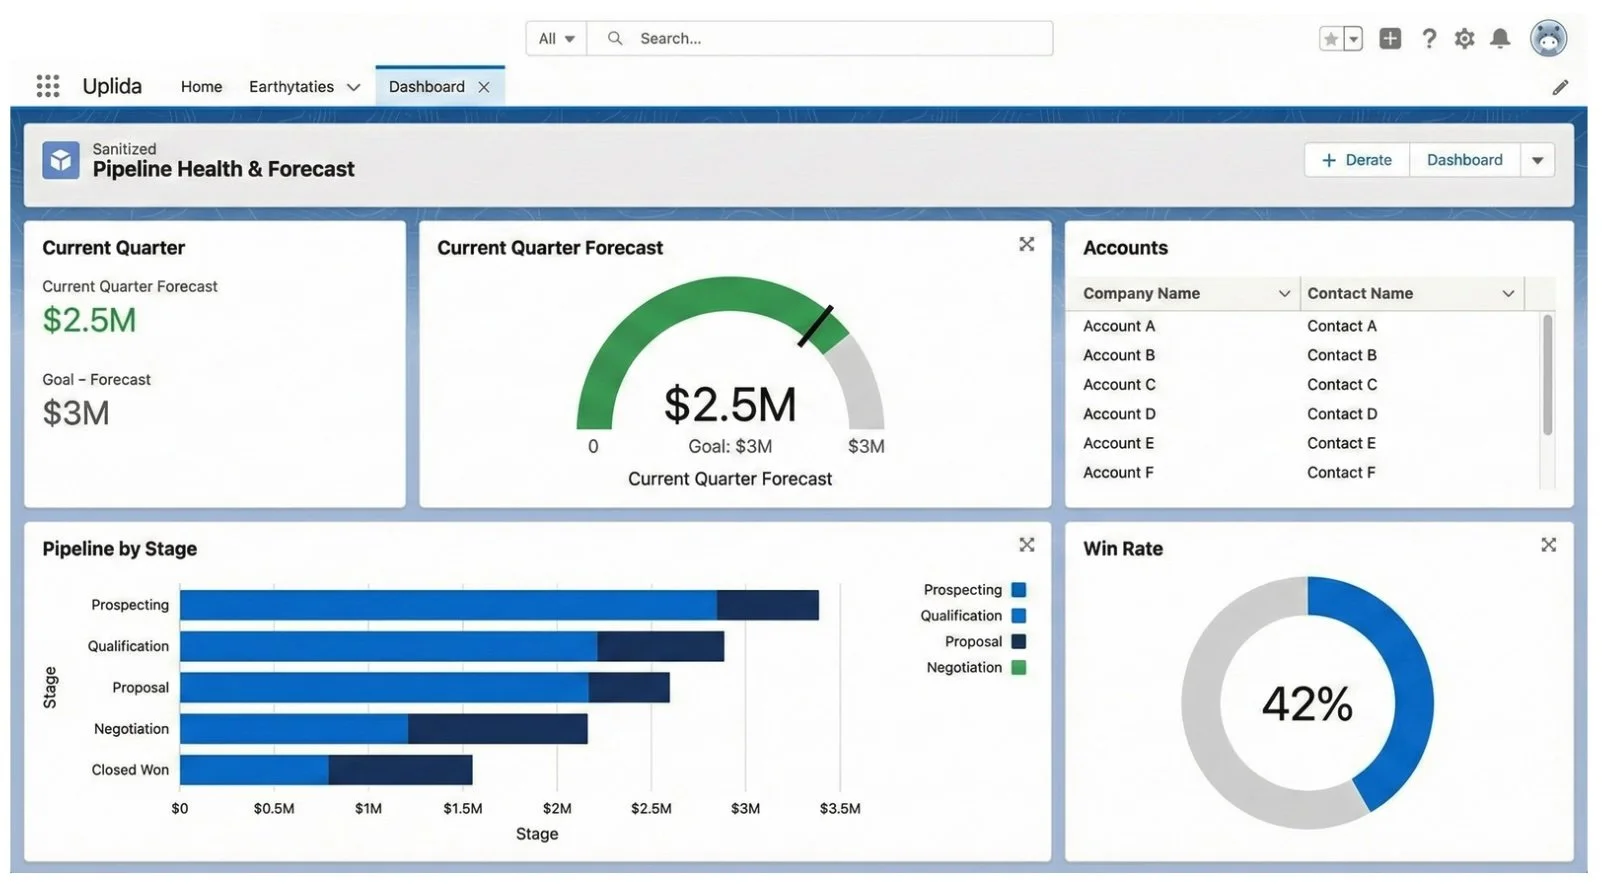
Executive Pipeline Health Dashboard (Salesforce)
This high-level dashboard is the cornerstone of your weekly forecast cadences. It provides an immediate, real-time view of the current quarter's performance against goals, pipeline distribution by stage, and overall win rate. This view is essential for quick assessments and guiding high-level strategy discussions.
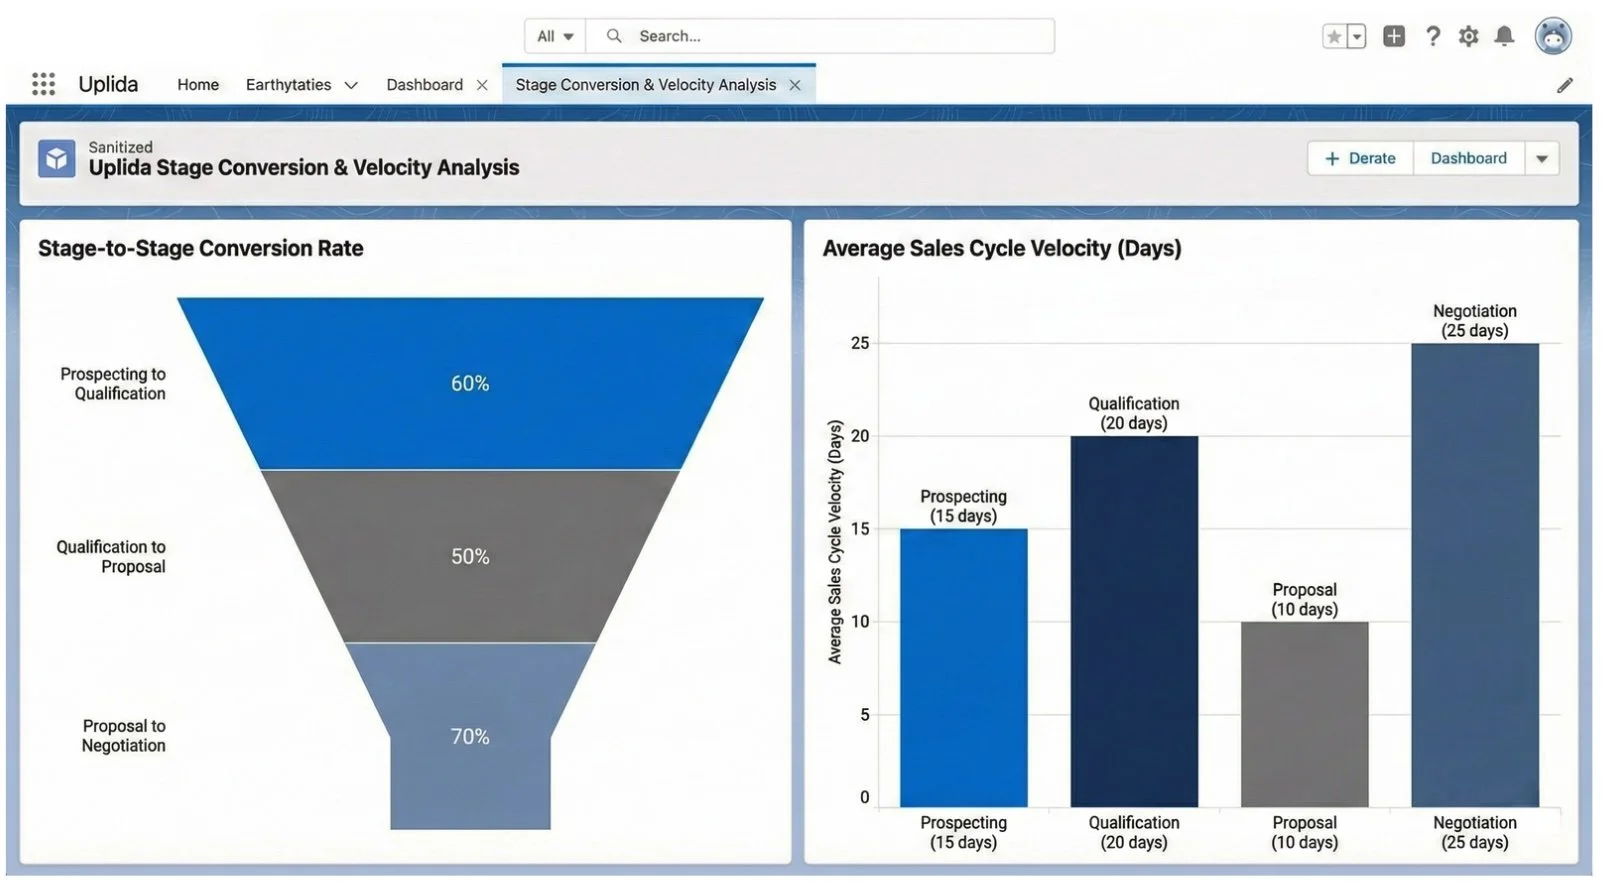
Stage Conversion & Velocity Analysis (Tableau)
To understand the "why" behind the numbers in the executive dashboard, you utilize this detailed Tableau report. It visualizes the conversion rates between each sales stage and the average time deals spend in each stage. This analysis is crucial for identifying bottlenecks in the sales process and improving forecast accuracy.
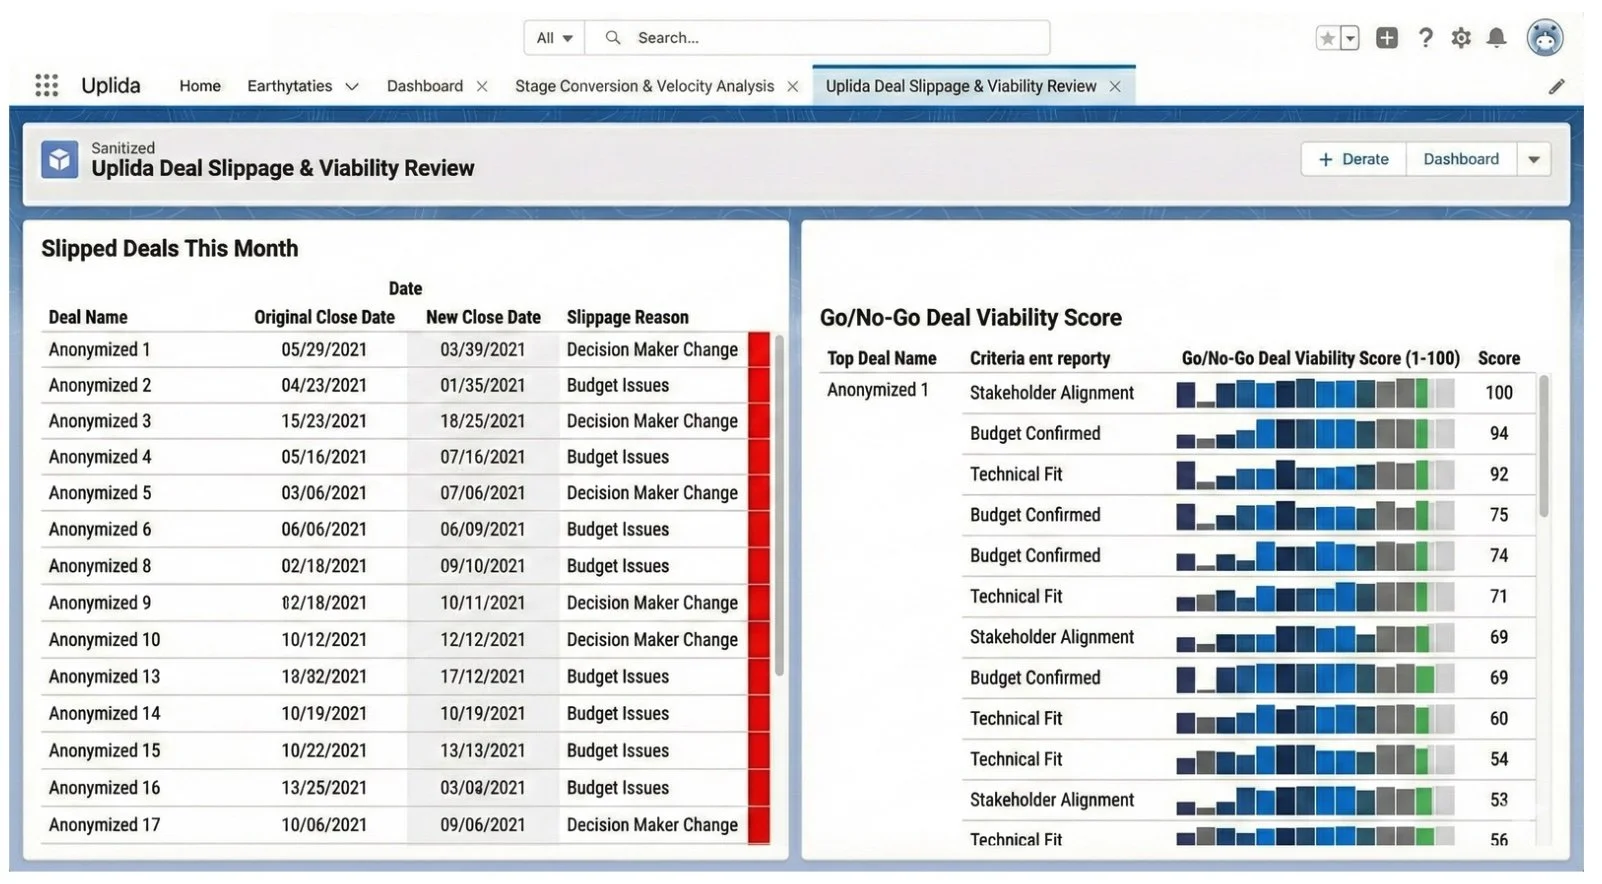
Deal Slippage & Viability Review (Tableau)
This report is a key component of your weekly business reviews (WBRs). It highlights deals that have "slipped" from their expected close dates, along with the reasons, allowing for proactive intervention. The "Go/No-Go Deal Viability Score" provides a data-driven assessment of deal health, helping to prioritize efforts on the most promising opportunities.
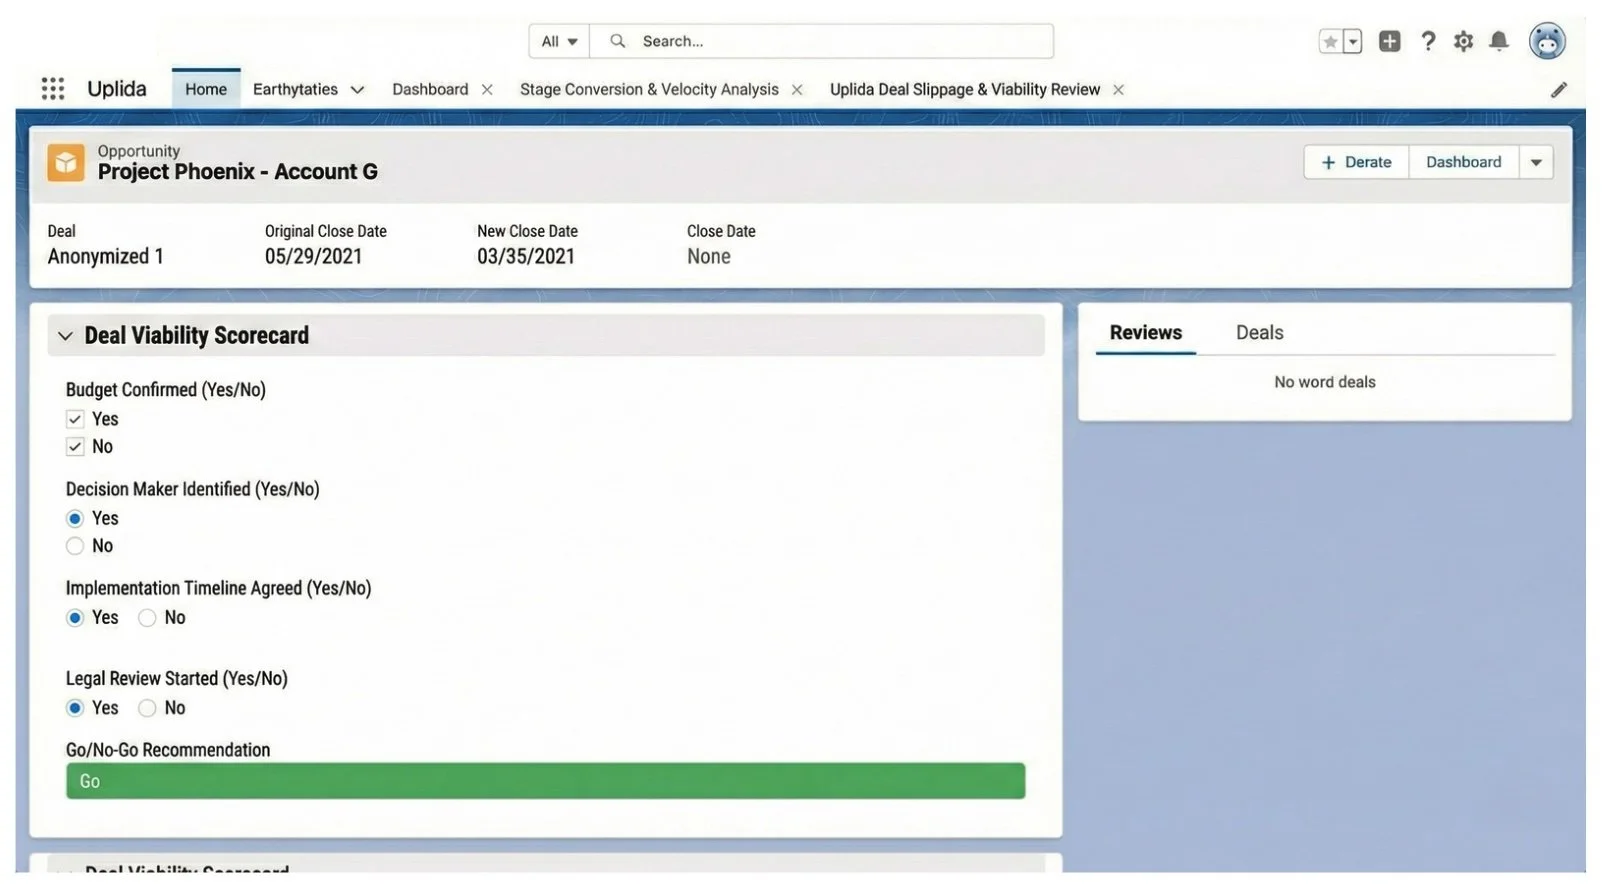
Deal Viability Scorecard (Salesforce)
The operational application of your deal viability process. This scorecard, embedded directly within a Salesforce opportunity record, ensures that sales reps are rigorously qualifying deals against a standard set of criteria. This bottoms-up approach is what ultimately drives the accuracy and predictability of the top-down forecast.